Candlestick patterns are visual representations of price movements that help traders identify potential market reversals and continuations trend analysis. Deriv MT5 is the charting and trading platform that allows UAE traders to analyse these candlestick signals across forex, indices, and synthetic markets forex trading basics using real-time, highly customisable tools. On this platform, candlestick structures become powerful analytical signals that support more informed trading decisions.
Quick summary
- Deriv MT5 trading charts offer some of the most customisable candlestick views, tailored for UAE market conditions with real-time data and regional support.
- Intermediate-level patterns like Engulfing, Morning Star, Evening Star, Doji, and Harami offer advanced insight into reversals or continuation.
- Combining candlestick patterns with technical indicators such as RSI or MACD is especially effective in the UAE’s active trading hours.
- The Deriv demo account makes it easy to practise and validate these strategies risk-free.
Quick refresher: Candlestick chart basics
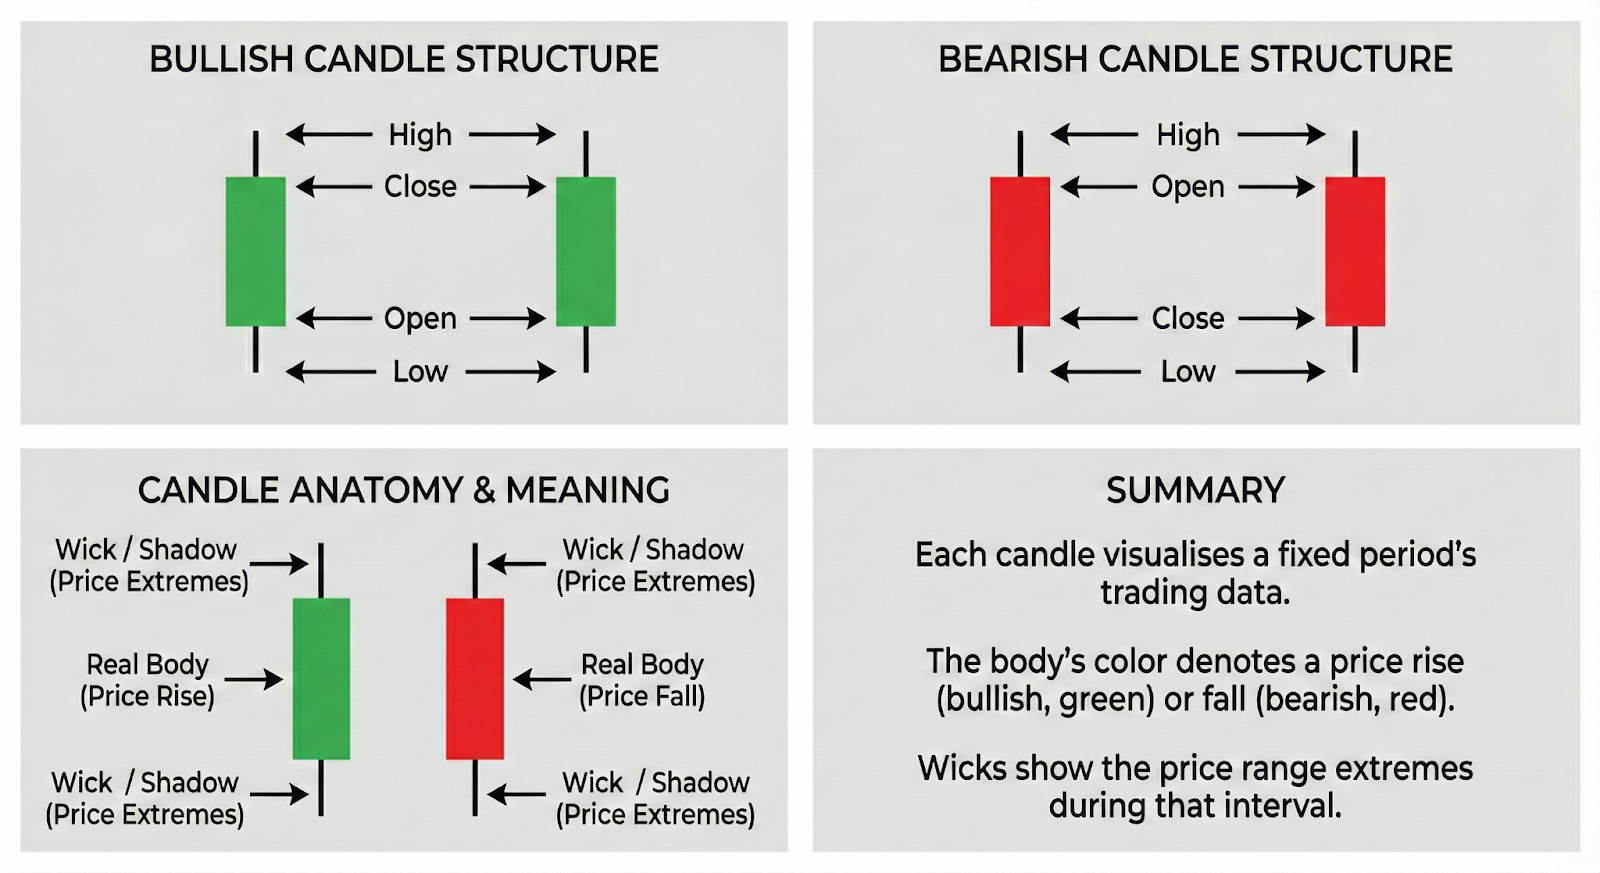
On Deriv, candlestick charts are available for all asset classes on Deriv MT5. Each candle visualises a fixed period’s trading data—showing open, close, high, and low. A candle’s body colour denotes bullish (price rise) or bearish (price fall) behaviour, while the wick reveals price extremes during that interval.
For UAE traders, being able to spot rapid shifts in market direction is crucial, especially during periods of regional volatility or during major global news events.
For more help with how to read candlestick charts, refer to our beginner-friendly guide on how to read trading charts.
Why patterns matter: Insights for intermediate UAE traders
In the GCC region, markets often show abrupt shifts around global news, energy sector headlines, or during Ramadan when liquidity patterns change. Intermediate candlestick patterns provide clues that help traders anticipate these changes.
- Market psychology: Patterns highlight the ongoing battle between buyers and sellers, revealing moments where shifting sentiment can trigger a cascade of orders.
- Statistical edge: According to Investopedia, reversal patterns add significant edge when confirmed with volume and context.
- Local relevance: UAE markets often display distinct volatility cycles, making reversal and continuation patterns particularly meaningful.
These patterns offer insight into not just price movement, but the reasons behind those moves—especially in high-volatility, low-gap environments.
Key intermediate candlestick patterns on Deriv MT5
Below are the essential intermediate patterns every UAE trader should recognise. Each includes what the pattern signals, how to confirm it, and why it matters in regional market conditions.
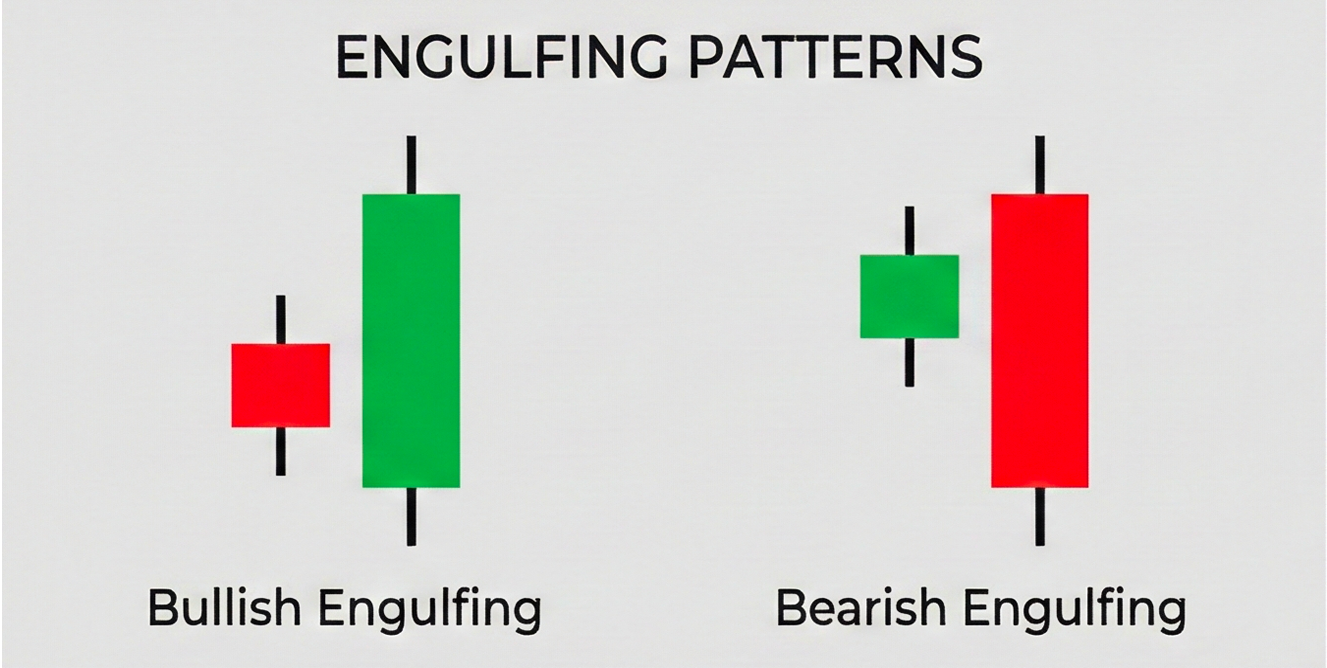
Engulfing Patterns
What it signals:
A bullish engulfing pattern indicates buyers have overwhelmed sellers, while a bearish engulfing pattern suggests the opposite. These patterns often appear near major support or resistance levels and can hint at a potential breakout or retracement.
Criteria
- Appears after a clear trend (downtrend for bullish, uptrend for bearish).
- The engulfing candle’s real body completely covers the previous candle’s body.
- No significant gaps between the bodies on real-time charts.
Confirmation
- Close above (bullish) or below (bearish) the engulfing candle.
- Rising volume or increased synthetic index tick momentum.
Confluence with support/resistance or a divergence signal on RSI.
UAE market relevance
- Engulfing patterns often appear during periods of heightened volatility around oil-related announcements or regional market opens.
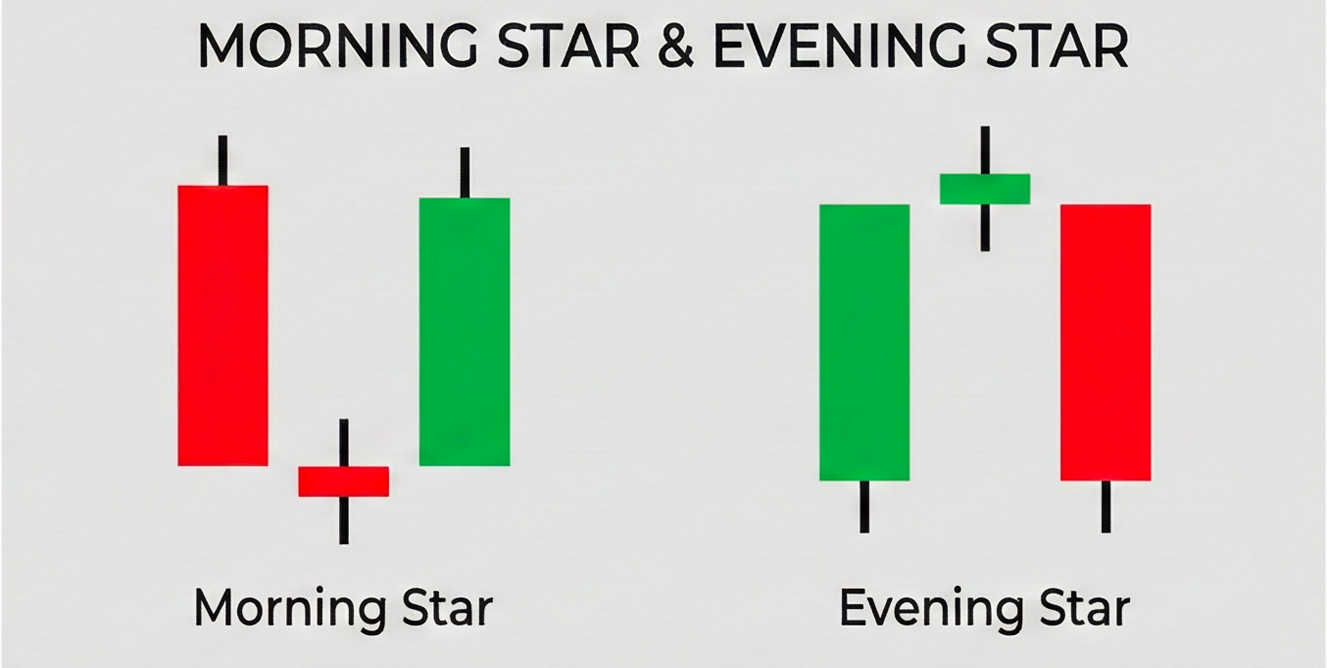
Morning Star & Evening Star patterns
Morning Star Pattern
What it signals:
A potential bullish reversal, indicating exhaustion in a downtrend and renewed buying interest.
Criteria
- Appears after a visible downtrend.
- Long bearish candle → small indecision candle → strong bullish candle closing halfway into the first candle's body.
- Often forms at major support or after extended declines.
Confirmation
- Close above the high of the third candle.
- RSI rising from oversold or a bullish MACD crossover.
Volume increasing on the third candle.
Prevalence of this pattern
This pattern often appears on UAE stock charts during periods of thin liquidity, such as early morning sessions or Ramadan trading hours.
Evening Star pattern
What it signals:
A potential bearish reversal showing buyers losing strength at key resistance.
Criteria
- Appears after a sustained uptrend.
- Long bullish candle → small indecision candle → strong bearish candle closing halfway into the first candle.
Confirmation
- Close below the low of the third candle.
- RSI turning down from overbought or bearish MACD cross.
- Increasing volume on the third candle.
When you might spot this pattern in the UAE
- This pattern frequently appears on US stocks traded by UAE investors during after-hours volatility and around major earnings releases.
Doji and Its Variants
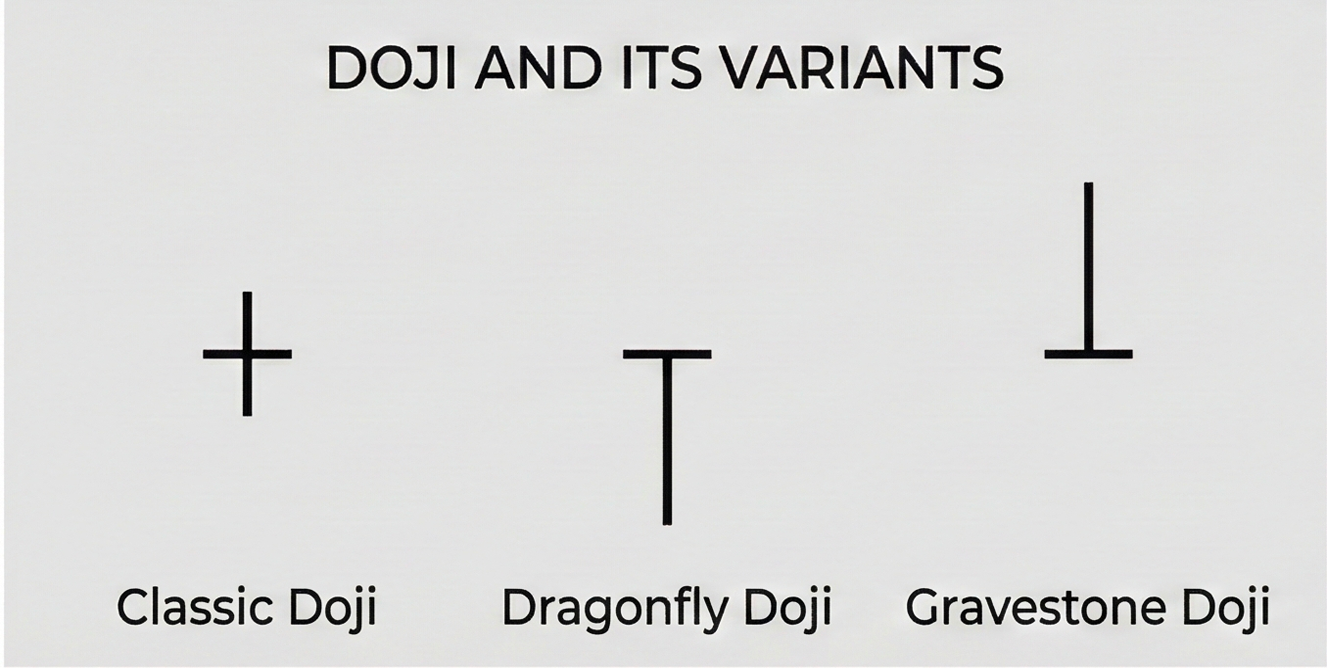
What it signals:
A doji reflects indecision and often hints at a potential trend reversal, especially when combined with volatility contraction or divergence signals.
Criteria
- Open and close nearly identical.
- Noticeable wicks above or below.
- Stronger impact after extended moves.
Confirmation
- Break above or below the doji range.
- Confluence with overextended RSI or Bollinger Band touch.
Other important facts about Doji candles
- Doji candles are common near market opens when liquidity is uneven in UAE equities.
- Traditional doji reversals show ~50-55% reversal success—best when paired with additional context (see Investopedia on Doji).
Harami Patterns
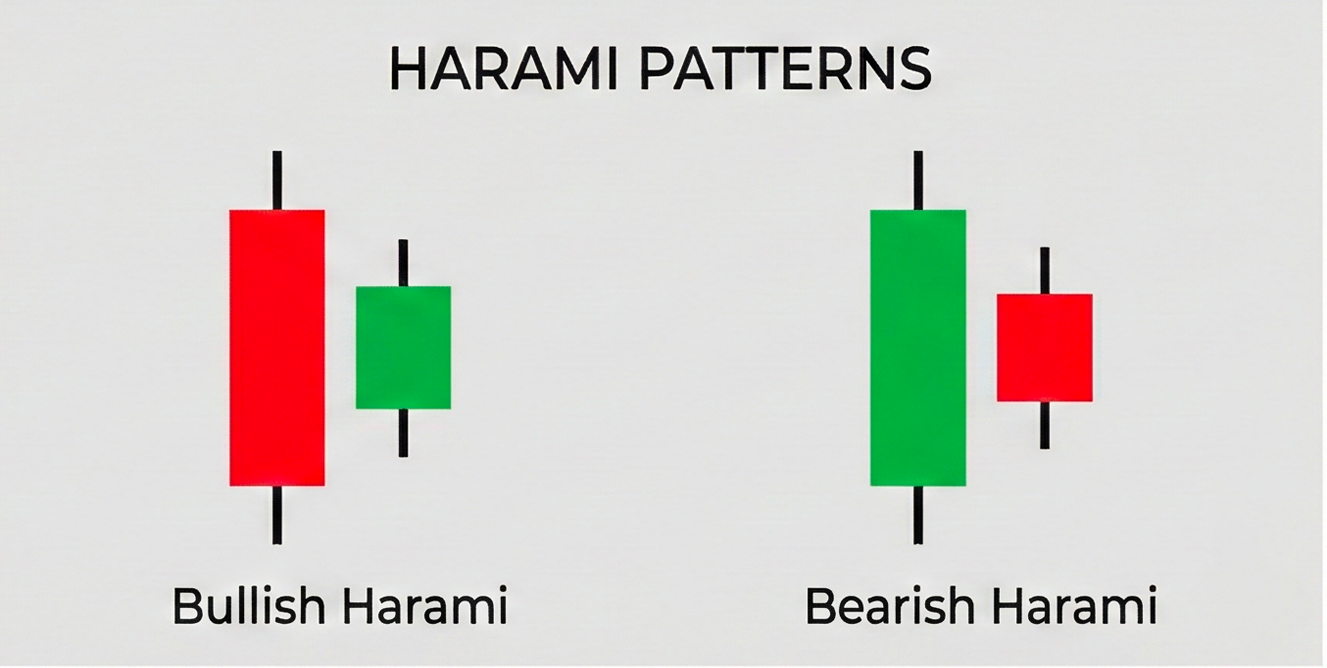
What it signals:
A potential pause or reversal as momentum weakens. Harami patterns indicate market hesitation before a breakout or trend continuation.
Criteria
- Preceded by an established trend.
- Large candle followed by a smaller candle entirely within its body.
Confirmation
- Volume drop on the harami candle.
- Close beyond the harami range.
- Increased reliability when near a trendline or Bollinger Band.
When you might spot Harami patterns:
- Harami structures often appear during periods of rapid volatility shifts.
Deriv MT5 includes built-in tools that help traders validate these signals quickly.
For more information on Chart Patterns and how to spot them, take a look at our free e-book on 10 Chart Patterns Every Trader Should Know by veteran trader Vince Stanzione.
Setting up and using candlestick charts on Deriv MT5
- Log in to your Deriv MT5 account.
- Choose your asset (e.g., EUR/USD)
- Select chart type: Click the chart settings wheel and select “Candlestick.”
- Set your timeframe: Choose from tick, 1-minute, 15-minute, 1-hour, or daily.
- Overlay indicators: Click ‘Add indicators’ and choose MACD, RSI, or Moving Average.
- Use annotation tools: Mark patterns by drawing arrows, boxes, or using the “Pattern Label” shortcut.
- Save your workspace: Click “Templates” to save your setup for future analysis or recovery.
Troubleshooting tips
- Refresh browser or clear cache if data appears delayed.
- Match timeframe to your trade horizon—faster charts show more volatility.
- Reset to the Default template if toolbars disappear.
Best practices when using pattern signals
- Combine pattern signals with position sizing strategies.
- Refer to the Deriv risk management guide before trading live.
- Avoid relying on a single candlestick pattern; always confirm with indicators or trend direction.
Avoiding common pitfalls when using chart patterns
- Relying solely on single patterns: Success increases when confirming with trend, volume, and other indicators.
- Ignoring market context: Patterns forming at support or resistance carry far more weight—be cautious of false signals mid-range.
- Not using platform features: Saving chart templates and using pattern annotation make reviewing and reusing successful setups much easier.
Advanced tips: Combining patterns with indicators technical indicators
UAE traders often strengthen their strategy with:
- RSI + MACD: Overbought/oversold areas paired with engulfing or harami patterns.
- Moving averages: Signals triggered near the 200-MA often lead to major moves.
- Bollinger Bands: Reversal patterns forming near the upper or lower bands often signal mean reversion.
UAE-specific things to consider when trading
- Ramadan and regional holidays affect liquidity and volatility.
- DFM index and UAE blue-chip stocks often show clearer patterns on 30-minute and daily charts.
Gaining an understanding of the intermediate candlestick patterns means gaining access to powerful signals that basic chart reading ignores. The platform’s advanced, multilingual chart tools—paired with UAE-specific market insights and rigorous educational resources—ensure local traders are always a step ahead. Use your Deriv demo account to perfect these skills, then harness them in live trading for real impact.
Quiz
Which candlestick pattern most often marks a strong reversal after a downtrend?
FAQs


%20v01.webp)